Salt Lake County Election Statistics
2018 and 2022 Turnout Detail Notes and Data
Download as PDF: 20182022TurnoutDetailFinal.pdf
The chart compares Registered Voters, Ballots Cast, and % Voter Turnout between the 2018 and 2022 elections in Salt Lake County.
Redistricting occurred in 2021 so precinct boundaries have changed from 2018 to 2022. To compare election results by precinct between 2018 and 2022 is not achievable with the available data, so precinct groupings were created based on city or census designated place precinct prefixes. For example, all of the Magna precincts were grouped into MAG. Magna is an example of one area with boundaries that haven’t really changed.
Despite the groupings, there will still be boundary issues, so we aren’t comparing exactly the same geographic areas. If any grouping looks interesting it should be studied more closely to get better alignment with the analogous 2018 equivalent precincts.
Salt Lake City has been split into westside and eastside with the I-15 as the divider. GSL (Greater Salt Lake) was added to the westside. EMG (Emigration Canyon) and PCN (Parley’s Canyon) were added to the eastside. The precincts along the southeast border of Salt Lake City touch South Salt Lake (SSL) and Millcreek (MIL) and the boundaries between them do show some change.
These adjustments and others are mentioned in the red data footnotes.
Voter turnout was 81.9% in 2018 and 64.9% in 2022. Percent decrease is calculated as (2018 % Turnout - 2022 % Turnout) / 2018 % Turnout.
| 2018 | 2022 | |||||||||
| Precinct Grouping | Reg Voters |
Ballots Cast |
% Turnout | Reg Voters |
Ballots Cast |
% Turnout | % Turnout Decrease |
|||
| ALT001 (Alta Vista) | 155 | 131 | 84.52% | (1) | 188 | 139 | 73.94% | 12.52% | ||
|---|---|---|---|---|---|---|---|---|---|---|
| BLF (Bluffdale) | 6370 | 4962 | 77.90% | 9404 | 6050 | 64.33% | 17.41% | |||
| BRT (Brighton) | 276 | 248 | 89.86% | (2) | 370 | 282 | 76.22% | 15.18% | ||
| CBL (p/o Murray) | 523 | 407 | 77.82% | 329 | 188 | 57.14% | 26.57% | |||
| COP001 (Copperton) | 430 | 362 | 84.19% | 473 | 276 | 58.35% | 30.69% | |||
| COT (Cottonwood) | 19961 | 17149 | 85.91% | 21598 | 16003 | 74.09% | 13.76% | |||
| DRP (Draper) | 21872 | 17519 | 80.10% | (7) | 26129 | 17420 | 66.67% | 16.77% | ||
| GNT (Granite) | 683 | 590 | 86.38% | 761 | 567 | 74.51% | 13.75% | |||
| HER (Herriman) | 17887 | 13614 | 76.11% | 27019 | 15744 | 58.27% | 23.44% | |||
| HOL (Holladay) | 19380 | 17136 | 88.42% | 20579 | 15649 | 76.04% | 14.00% | |||
| KRN (Kearn) | 11751 | 8567 | 72.90% | 13524 | 6887 | 50.92% | 30.15% | |||
| LTC (Little Cottonwood) | 71 | 66 | 92.96% | 60 | 45 | 75.00% | 19.32% | |||
| MAG (Magna) | 9708 | 7346 | 75.67% | 11922 | 6193 | 51.95% | 31.35% | |||
| MID (Midvale) | 13291 | 10809 | 81.33% | 15387 | 9073 | 58.97% | 27.49% | |||
| MIL (Millcreek) | 33225 | 28927 | 87.06% | (4) | (3) | 35858 | 25975 | 72.44% | 16.80% | |
| MUR (Murray) | 25820 | 21982 | 85.14% | 28369 | 19534 | 68.86% | 19.12% | |||
| RIV (Riverton) | 21757 | 17706 | 81.38% | 25680 | 17227 | 67.08% | 17.57% | |||
| SAN (Sandy) | 51350 | 42867 | 83.48% | 56265 | 38853 | 69.05% | 17.28% | |||
| SHL (p/o Sandy) | 1171 | 991 | 84.63% | 1251 | 855 | 68.35% | 19.24% | |||
| SIL (p/o Sandy) | 190 | 147 | 77.37% | 220 | 136 | 61.82% | 20.10% | |||
| SJD (South Jordan) | 37347 | 30378 | 81.34% | (1) | (4) | 46826 | 31503 | 67.28% | 17.29% | |
| SLC Westside (inc GSL) | 16534 | 12326 | 74.55% | (2) | (5) | 20185 | 10642 | 52.72% | 29.28% | |
| SLC Eastside (inc EMG PCN) | 77029 | 67447 | 87.56% | (3) | (6) | 78888 | 58329 | 73.94% | 15.56% | |
| SNB001 (Snowbird) | 12 | 8 | 66.67% | |||||||
| SSL (South Salt Lake) | 7920 | 6408 | 80.91% | 10084 | 6071 | 60.20% | 25.59% | |||
| SWT (w/o Herriman) | 537 | 429 | 79.89% | (8) | (7) | 645 | 403 | 62.48% | 21.79% | |
| TAY (Taylorsville) | 25934 | 20811 | 80.25% | 28794 | 18088 | 62.82% | 21.72% | |||
| WBN (Oquirrh?) | 1016 | 772 | 75.98% | (5) | (8) | 1222 | 694 | 56.79% | 25.26% | |
| WCN (Willow Canyon) | 442 | 375 | 84.84% | 456 | 335 | 73.46% | 13.41% | |||
| WCR (Willow Creek) | 1050 | 894 | 85.14% | 731 | 521 | 71.27% | 16.29% | |||
| WHT (White City) | 2848 | 2326 | 81.67% | 3074 | 1960 | 63.76% | 21.93% | |||
| WJD (West Jordan) | 47037 | 37259 | 79.21% | (6) | 55461 | 32724 | 59.00% | 25.51% | ||
| WVC (West Valley City) | 43867 | 32989 | 75.20% | 50247 | 26198 | 52.14% | 30.67% | |||
| TOTALS: | 517444 | 423948 | 81.93% | 591999 | 384564 | 64.96% | 20.71% | |||
| (1) includes NJC001 | (1) includes SNB (Snowbird) from 2018? | |||||||||
| (2) includes GSL001 | (2) includes BGC (Big Cottonwood) | |||||||||
| (3) includes EMG001, PCN001 | (3) includes MOL (Millcreek Canyon) | |||||||||
| (4) includes MOL (Millcreek Canyon) | (4) includes ISL001, which was probably NJC001 in 2018 | |||||||||
| (5) WBN roughly OQR in 2022? | (5) includes GSL001 (Greater Salt Lake) | |||||||||
| (6) includes FUR001 | (6) includes EMG (Emigration Cyn), PCN (Parley's Cyn) | |||||||||
| (7) includes CCN (Cottonwood Cyn) | (7) area west of Herriman | |||||||||
| (8) area w/o Herriman | (8) was OQR roughly equivalent to WBN in 2018? | |||||||||
2022 % Decrease in Turnout Sorted
from Greatest % Decrease to Smallest% Decrease
The following table sorts the precinct groupings of 2022 by the percent decrease in turnout from 2018.
Download as PDF: 20182022TurnoutDetailSorted.pdf
| PRECINCT GROUPING |
% Turnout Decrease |
2022 Reg Voters |
|---|---|---|
| MAG (Magna) | 31.35% | 11922 |
| COP001 (Copperton) | 30.69% | 473 |
| WVC (West Valley City) | 30.67% | 50247 |
| KRN (Kearn) | 30.15% | 13524 |
| SLC Westside (inc GSL) | 29.28% | 20185 |
| MID (Midvale) | 27.49% | 15387 |
| CBL (p/o Murray) | 26.57% | 329 |
| SSL (South Salt Lake) | 25.59% | 10084 |
| WJD (West Jordan) | 25.51% | 55461 |
| WBN (Oquirrh?) | 25.26% | 1222 |
| HER (Herriman) | 23.44% | 27019 |
| WHT (White City) | 21.93% | 3074 |
| SWT (w/o Herriman) | 21.79% | 645 |
| TAY (Taylorsville) | 21.72% | 28794 |
| SIL (p/o Sandy) | 20.10% | 220 |
| LTC (Little Cottonwood) | 19.32% | 60 |
| SHL (p/o Sandy) | 19.24% | 1251 |
| MUR (Murray) | 19.12% | 28369 |
| RIV (Riverton) | 17.57% | 25680 |
| BLF (Bluffdale) | 17.41% | 9404 |
| SJD (South Jordan) | 17.29% | 46826 |
| SAN (Sandy) | 17.28% | 56265 |
| MIL (Millcreek) | 16.80% | 35858 |
| DRP (Draper) | 16.77% | 26129 |
| WCR (Willow Creek) | 16.29% | 731 |
| SLC Eastside (inc EMG PCN) | 15.56% | 78888 |
| BRT (Brighton) | 15.18% | 370 |
| HOL (Holladay) | 14.00% | 20579 |
| COT (Cottonwood) | 13.76% | 21598 |
| GNT (Granite) | 13.75% | 761 |
| WCN (Willow Canyon) | 13.41% | 456 |
| ALT001 (Alta Vista) | 12.52% | 188 |
| SNB001 (Snowbird) | (2018 only) |
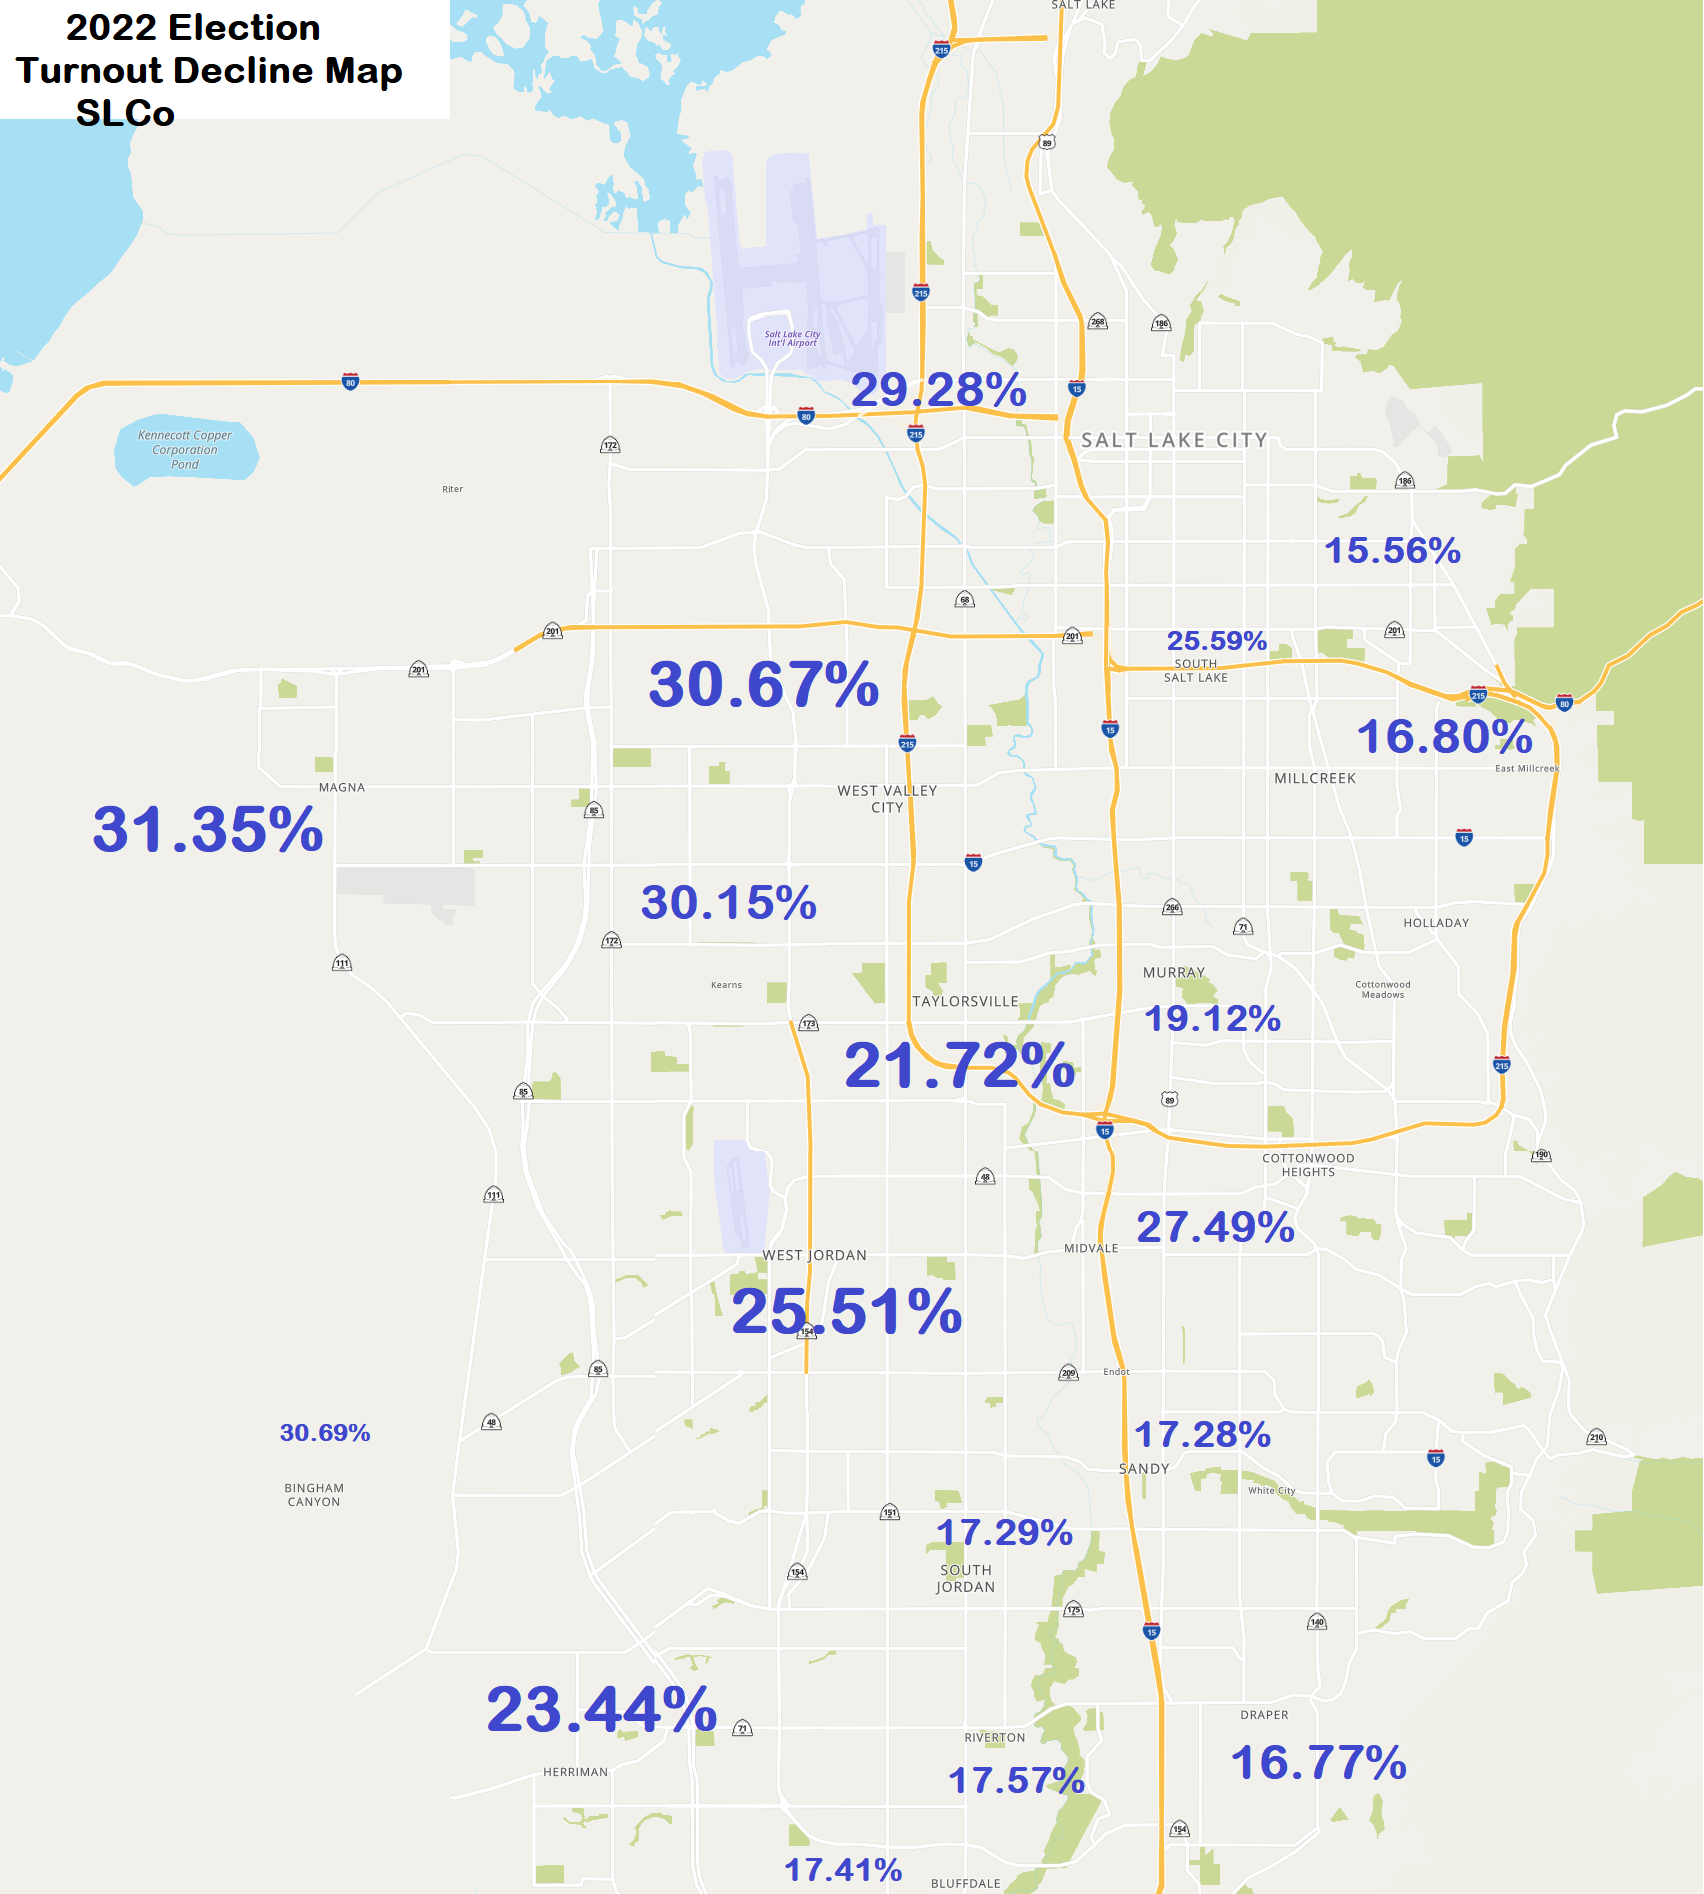
2022 % Decrease in Turnout County Map
Right-click to save.