Salt Lake County Election Statistics
Salt Lake County 2024 Population and Voting Age Forecast
Download the data below as a PDF: download
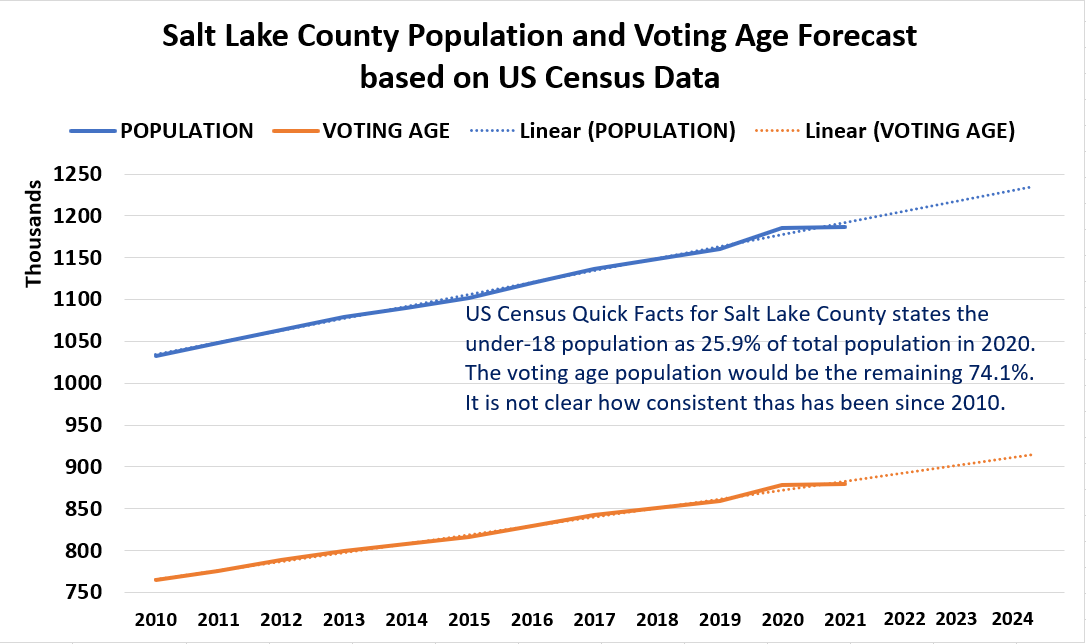
| YEAR | POPULATION | VOTING AGE |
|---|---|---|
| 2010 | 1032976 | 765435 |
| 2011 | 1047610 | 776279 |
| 2012 | 1063956 | 788391 |
| 2013 | 1079392 | 799829 |
| 2014 | 1090005 | 807694 |
| 2015 | 1102273 | 816784 |
| 2016 | 1120109 | 830001 |
| 2017 | 1136719 | 842309 |
| 2018 | 1148692 | 851181 |
| 2019 | 1160437 | 859884 |
| 2020 | 1185238 | 878261 |
| 2021 | 1186421 | 879138 |
Source data available from:
https://data.census.gov/cedsci/table?q=Population%20Total&g=0400000US49_0500000US49035&tid=PEPPOP2019.PEPANNRES
https://www.census.gov/quickfacts/saltlakecountyutah
Salt Lake City Demographics
The Gardner Policy Institute of the University of Utah provides insight into the populations of Salt Lake City in its Salt Lake City Data Book for 2022.
This diagram from Gardner shows the City Council districts (small graphic upper right) and the equivalent census tracts. Note the convenient division along I-15 between westside and eastside. Council District 1 is roughly northwest SL City; Council District 2 is roughly southwest.
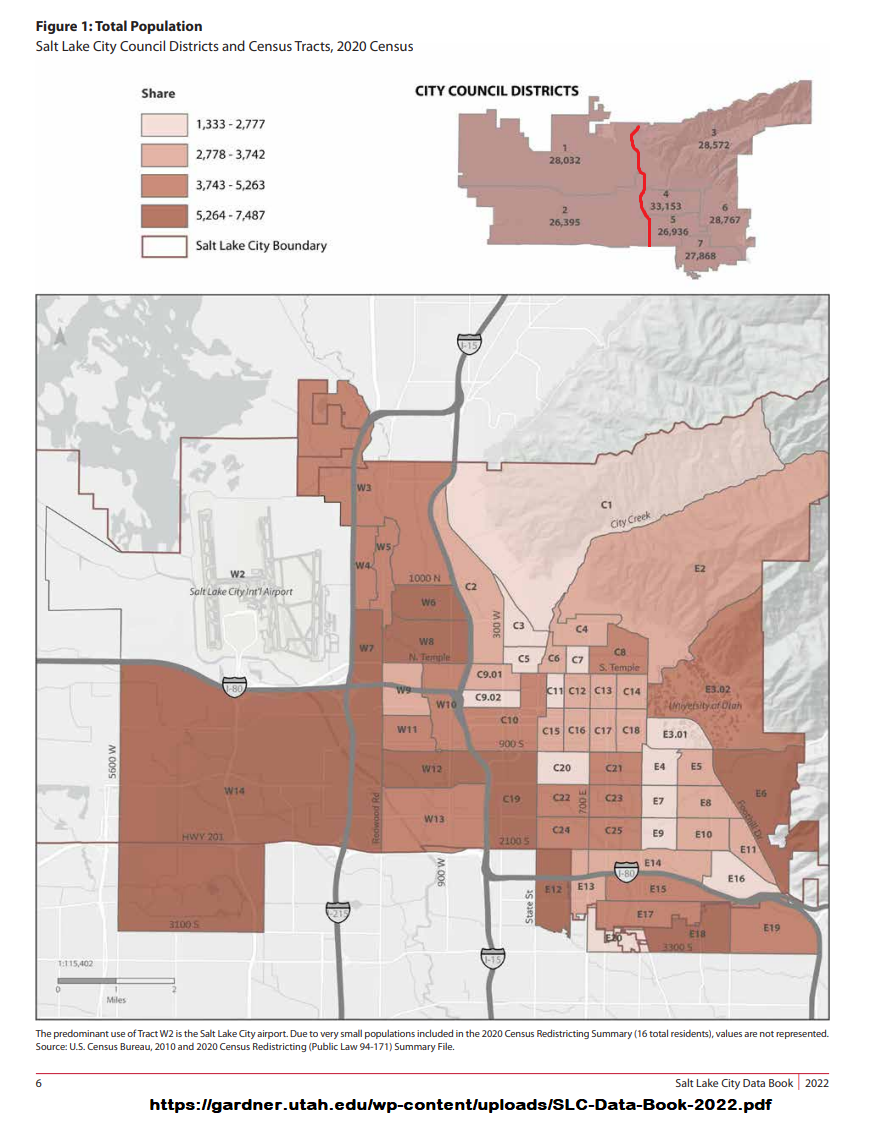
More than 20% of Salt Lake City residents identify as Hispanic or Latino. CD1 and CD2 (the westside) have the highest share of Hispanic residents. Page 26 states that 1/3 or more residents "in the western portion of Salt Lake" identify as Hispanic or Latino. Figure 18 and Table 18 mark the Hispanic population by Map Code (pages 42-43).
Sale Lake City westside precincts overall experienced a 29% voter turnout decline in 2022.