Salt Lake County Election Statistics
Salt Lake County State House Races in which GOP prevailed
Download as PDF: statehousedataslco.pdf
This page is historical data of Utah State House races pertinent to Salt Lake County from 2010. Data was extracted from source data available at: https://slco.org/clerk/elections/election-results/.
Some State House districts cross county boundaries. To confirm the candidate won a race across all the pertinent counties, check historical results at https://vote.utah.gov/historical-election-results/.
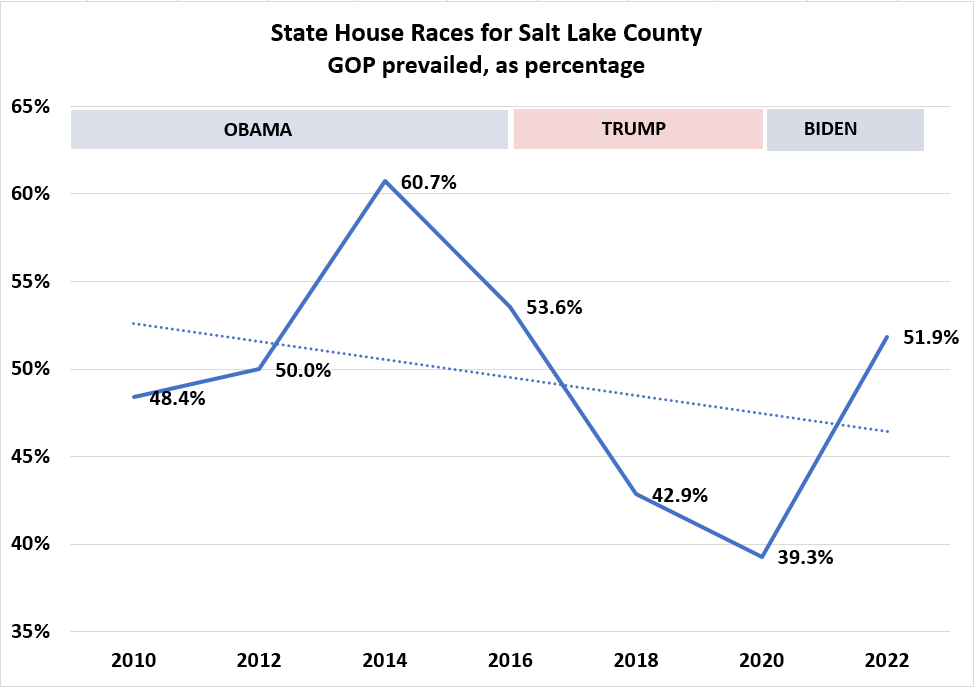
Since 2010, the county GOP has been doing better prevailing in State House races when a Democrat is in the White House. This is illustrated in the table and two charts below. Note the GOP contestant peak in 2014, the midterm of Obama's second term.
| State House Races for Salt Lake County | |||
| Year | # House Seats |
# GOP Prevails |
% GOP Prevails |
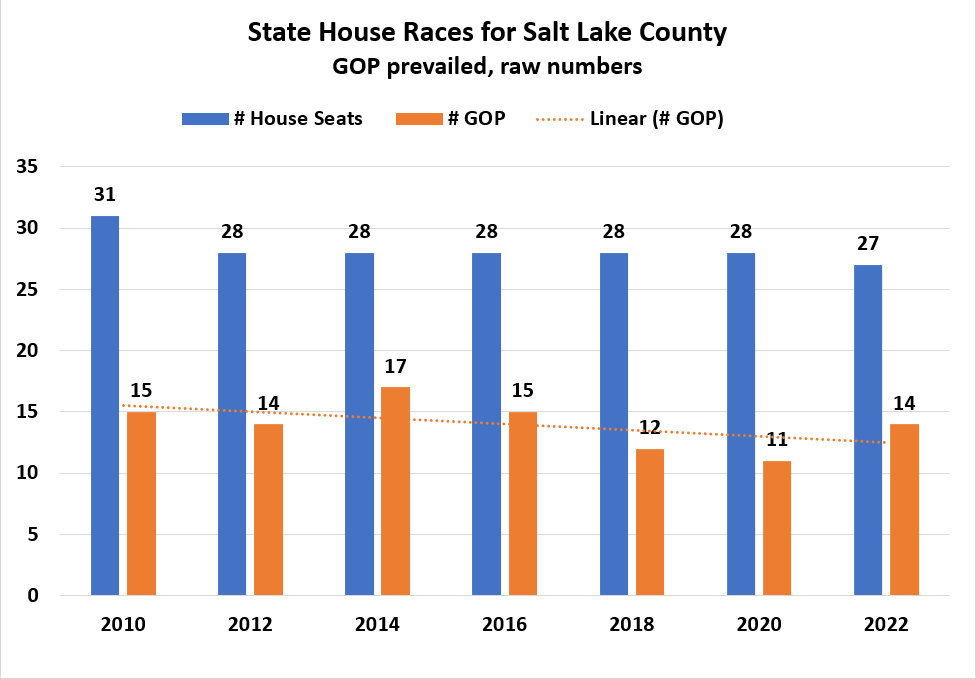
| 2010 | 31 | 15 | 48.4% |
| 2012 | 28 | 14 | 50.0% |
| 2014 | 28 | 17 | 60.7% |
| 2016 | 28 | 15 | 53.6% |
| 2018 | 28 | 12 | 42.9% |
| 2020 | 28 | 11 | 39.3% |
| 2022 | 27 | 14 | 51.9% |
The first chart expresses the ratio as a percentage.
The second chart shows the same data as raw numbers.
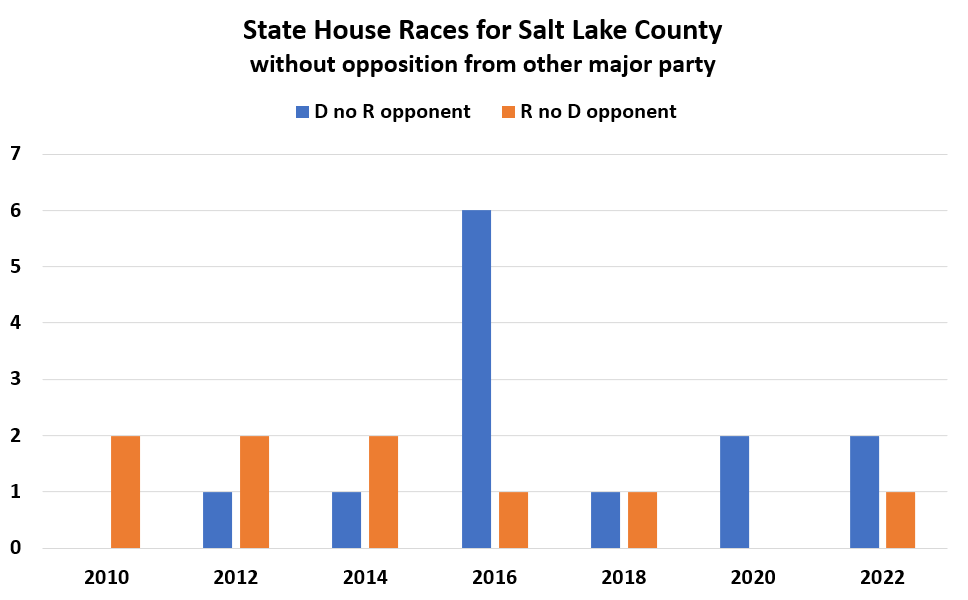
Salt Lake County State House Races
without opposition from major opposing party
In 2016, six Democrats ran for seats unchallenged by GOP opponents. They were Rebecca Chavez-Houck, Joel Briscoe, Angelo Romero, Brian King, Patrice Arent, and Marie Poulson.
| State House Races for Salt Lake County | ||
| Year | Dem no GOP opponent | GOP no Dem opponent |
| 2010 | 0 | 2 |
| 2012 | 1 | 2 |
| 2014 | 1 | 2 |
| 2016 | 6 | 1 |
| 2018 | 1 | 1 |
| 2020 | 2 | 0 |
| 2022 | 2 | 1 |