Salt Lake County Election Statistics
Election turnout is a percentage measured as ballots submitted (cards cast) compared to registered voters at the time of the election.
Utah State Historical Election Turnout
Download the data here as a PDF: download
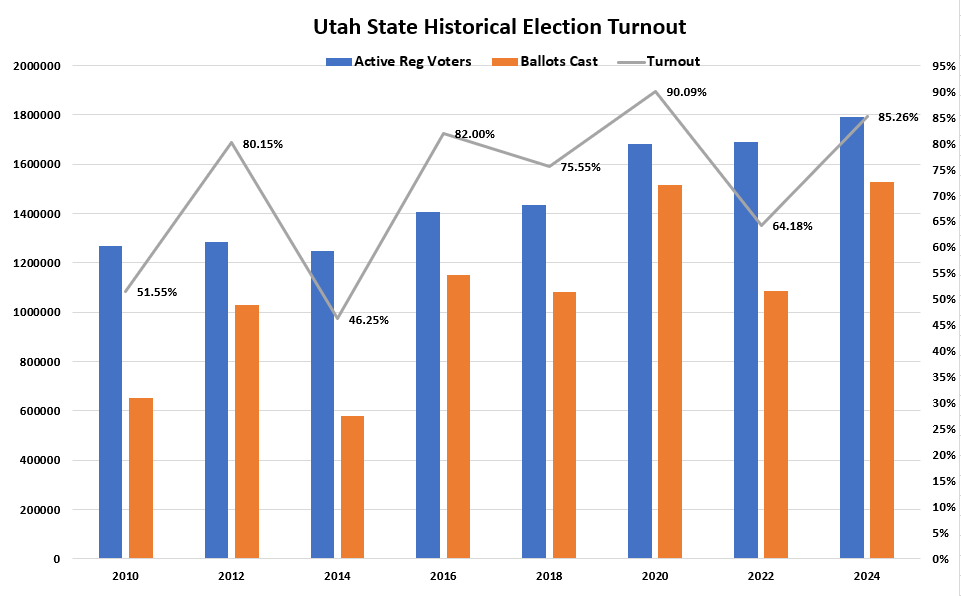
| REG VOTERS | BALLOTS CAST | TURNOUT | |
|---|---|---|---|
| 2010 | 1267250 | 653274 | 51.55% |
| 2012 | 1283526 | 1028786 | 80.15% |
| 2014 | 1249654 | 577973 | 46.25% |
| 2016 | 1405275 | 1152369 | 82.00% |
| 2018 | 1433498 | 1082972 | 75.55% |
| 2020 | 1682512 | 1515845 | 90.09% |
| 2022 | 1689918 | 1084634 | 64.18% |
| 2024 | 1793419 | 1529138 | 85.26% |
Source data available from https://vote.utah.gov/election-results-data-historical-information/
Salt Lake County Historical Election Turnout Summary and Forecast
Download the data here as a PDF: download
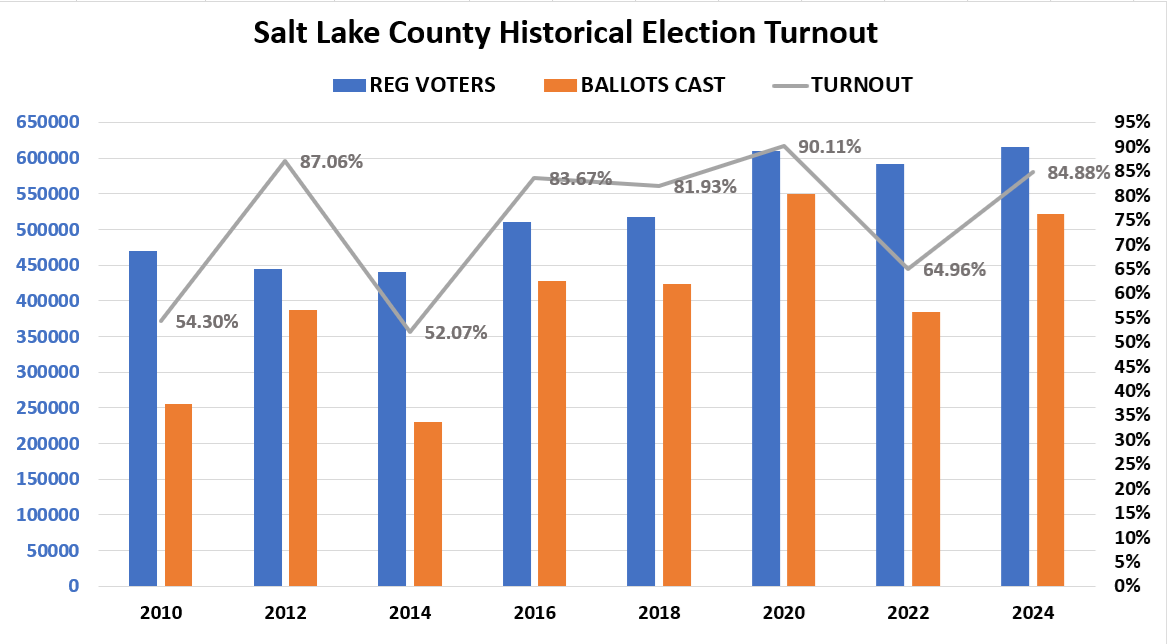
| REG VOTERS | BALLOTS CAST | TURNOUT | |
|---|---|---|---|
| 2010 | 470301 | 255385 | 54.30% |
| 2012 | 444196 | 386729 | 87.06% |
| 2014 | 440524 | 229379 | 52.07% |
| 2016 | 510397 | 427064 | 83.67% |
| 2018 | 517444 | 423948 | 81.93% |
| 2020 | 610218 | 549882 | 90.11% |
| 2022 | 591999 | 384564 | 64.96% |
| 2024 | 614757 | 521789 | 84.88% |
Source data available from https://saltlakecounty.gov/clerk/elections/
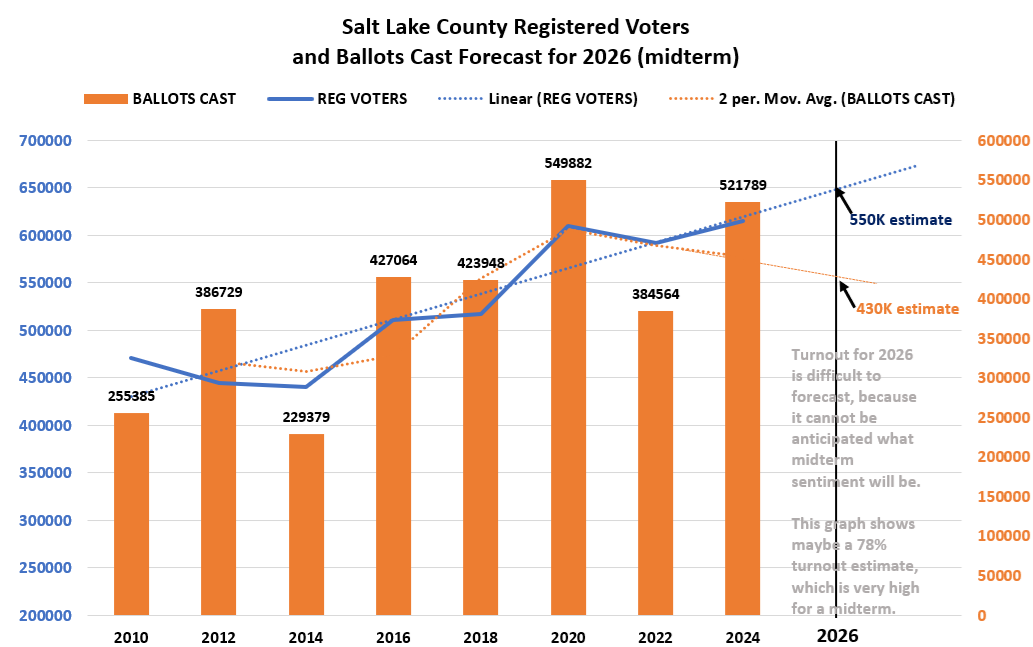
This forecast of registered voters and ballots cast in SLCO for the 2024 General Election was published 27 Feb 2023. It shows an estimate for roughly 625K registered voters and 510K ballots cast as a low estimate. For the General Election of 05 Nov 2024, registered voters were actually 614,757 (slightly lower than estimate) and 521,789, respectively (slightly higher than estimate.)

Estimating turnout for the 2026 midterm is difficult, as (at time of publication) midterm sentiment - and motivation to vote - cannot be anticipated. The graph shows a roughly 78% estimated turnout. There is probably not much upside to that, and lots of potential downside.